
News
Geopark at home 7
5 December 2024
Geopark at home
Activity 7 – marvellous maps
Download a printable version of these instructions here.
Maps show the important features of a place as if viewed from straight up above. But how do we turn a lumpy landscape into a flat map? Make a 3D model landscape to show how contour lines on maps tell us about the shapes.
You will need:
- A map with contour lines – OS maps or a free online version are good for this https://osmaps.ordnancesurvey.co.uk/ Most road atlases and street maps don’t show them
- Thick card – old cardboard boxes work well
- Pencil
- Scissors – younger readers might need a hand with the cutting
- Glue, e.g. Pritt stick
What to do:
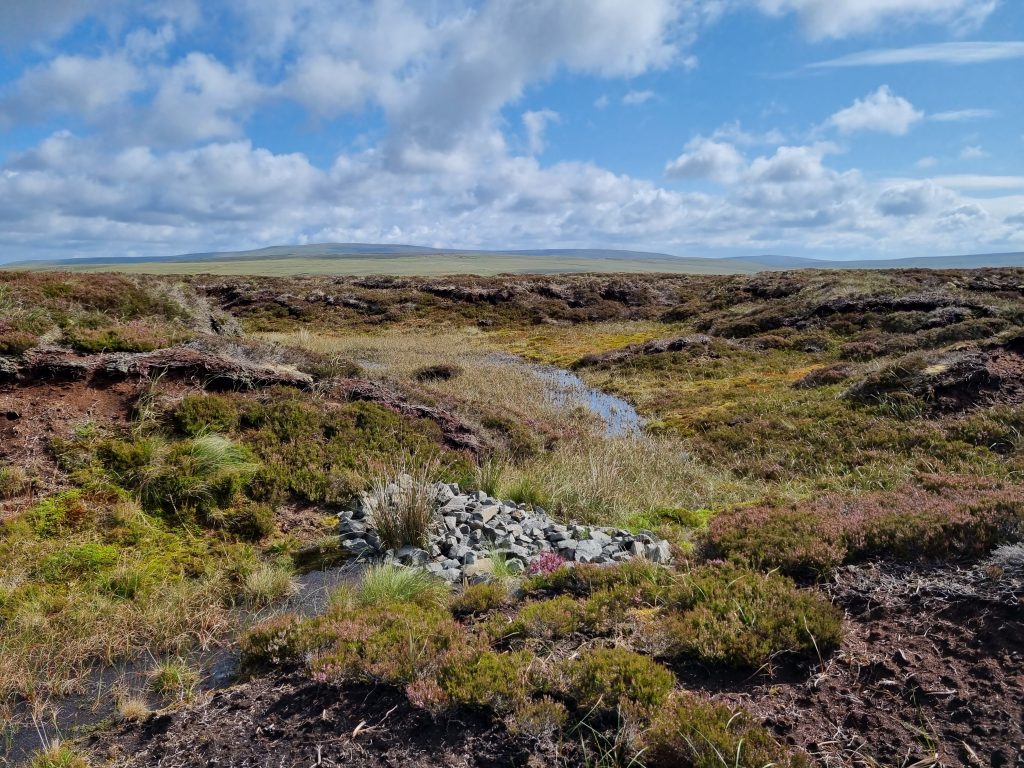
Have a close look at a map. Can you see the faint lines curving across it in the background? On an OS map they’re orange and have numbers on them in some places. On the web version they’re grey. These are contour lines. A map is an aerial view, drawn as if we were looking straight down on the world from up in the sky. But if you looked straight down, it would be hard to tell where the hills are and how high they are. Contour lines are a way of showing how high things are on a flat map. Everywhere on one contour line is the same height above sea level. In the UK we measure heights above the average sea level at Newlyn in Cornwall. Anyone using a map – geologists, walkers, cyclists, planners – can look at these lines and work out roughly what shape the land is.

Look at this contour map of the top part of Cross Fell, the tallest hill in the North Pennines. Draw the shapes of the contour lines onto carboard, using a new area for each new line. If you have a printer, the easiest way to do this is to download the picture by clicking here and print it on A4 paper. The numbers next to the lines tell you how many metres above sea level each line is, so this is only the very top of Cross Fell! Cut around the largest (and lowest) contour line on the paper. Draw around this onto your card. Now cut the outer part off the paper by cutting round the next line in. Draw around this smaller shape onto a new place on the card. Keep doing this until you have drawn all of the contour lines. Cut the shapes out of the card, as in the pictures below.
Stack the shapes up with the smallest at the top and the largest at the bottom. Try to arrange them in the same places as they appear on the picture. When you are ready, glue them together. You now have a model of the top of Cross Fell. You might want to colour it or label the heights.


What’s going on?
The shape you have made is what the contour lines on the map tell us. Of course the real Cross Fell has slopes and bumps, not just flat layers. If you were to create a smooth slope between the layers, you can see that when the lines are close together, you get a steep slope and when they are further apart you get a more gentle slope. This is very useful to know when trying to work out where you are, or plan a route for a walk or bike ride on a map. The shapes can also tell us about how the landscape is formed. For example, valleys formed by water are usually V-shaped and show up with pointy contour lines. See if you can find any of these on a map. Valleys formed by glaciers flowing over the land are more U-shaped with more curved lines. The landscape of the North Pennines has been shaped by water, ice, the rocks themselves and by people.

Take it further:
- Find an area on your map where the contour lines look interesting and have a go at making the shape, like you did for Cross Fell. Hilly places are usually good for this.
- Invent your own landscape by making hills, valleys and different shapes. You could use things waiting to be recycled, card, plasticine or playdough, sand, cushions… Have a go at drawing a map of it with contour lines to show which parts are higher and lower.
- My version of Cross Fell in the photos is not to scale. I’ve made the contours a bit higher than they should be compared to the size of the piece of paper. Each contour line is 10 metres higher than the last one. My card is about half a centimetre thick. So 10m = 0.5cm. The little oval that forms my highest piece of card is about 250m long on the top of Cross Fell in real life. Can you work out how long the card version should be?
- Look at some geological maps. These show the main features and sometimes contour lines, but use different colours to show what the main types of rock are in that place. Good maps of Britain can be viewed on the British Geological Survey website: http://mapapps.bgs.ac.uk/geologyofbritain/home.html
- Look at some historical maps to see how they have changed over time. The National Library of Scotland has a great online viewer with different types of maps from different dates (use the dropdown on the left hand side): https://maps.nls.uk/geo/find/
- Find map-related activities from the Ordnance Survey here: https://www.ordnancesurvey.co.uk/mapzone/
Share your pictures or comments on Facebook or Twitter, and let us know if you enjoyed this Geopark at home activity.
Facebook: https://www.facebook.com/NorthPenninesAONB
Twitter: https://www.twitter.com/NorthPennAONB
You may also like...

Did you know…


